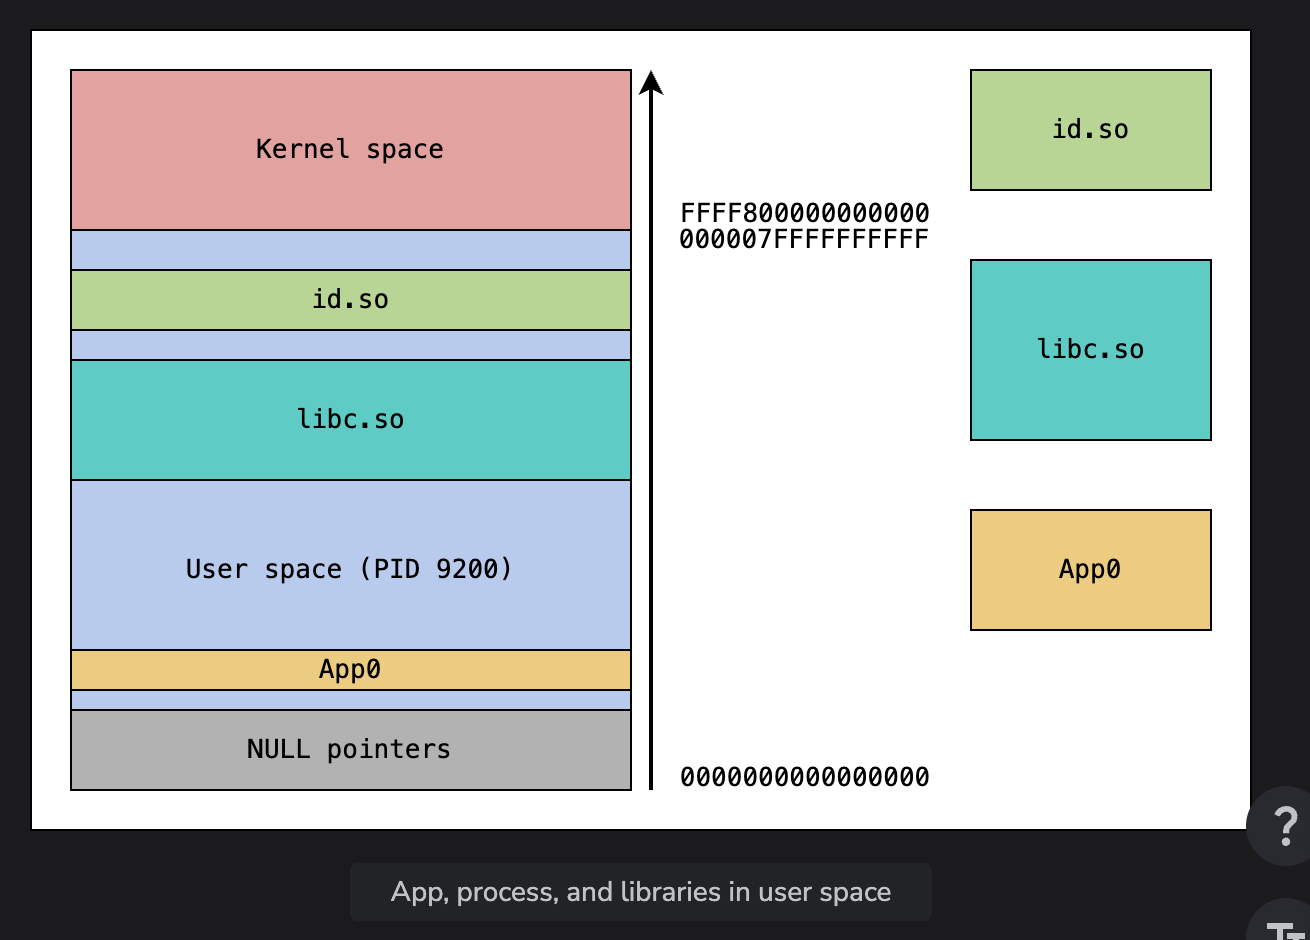
Virtual memory range is divided into the kernel space part, a user space part, and a inaccessible part for catching null pointers
cat /proc/sys/vm/mmap_min_addr
Mode is the execution privileage (code in kernel mode vs code in user mode). Kernel mode can access user space, this is used to prevent bad accesses
Uniform memory space presented to process is considered the virtual process space, and this is how all process dumps are presented
When an app is loaded, all the referenced dynamic libraries are mapped to a virtual memory space
A memory dump is the process of taking all the contents of ram and writing them into a readible file
Process memory dump is the user space protion of the process space saved, but also your memory is not usually filled, your core dump is has everything outside of kernel space (user and null)
GDB commands
info shared -> gets dynamic libraries
maintenence info sections -> get memory regions
LLDB commands
image list -> gets dynamic libraries
image dump sections -> Get memory regions
Kernel panic has kernel memory dump only
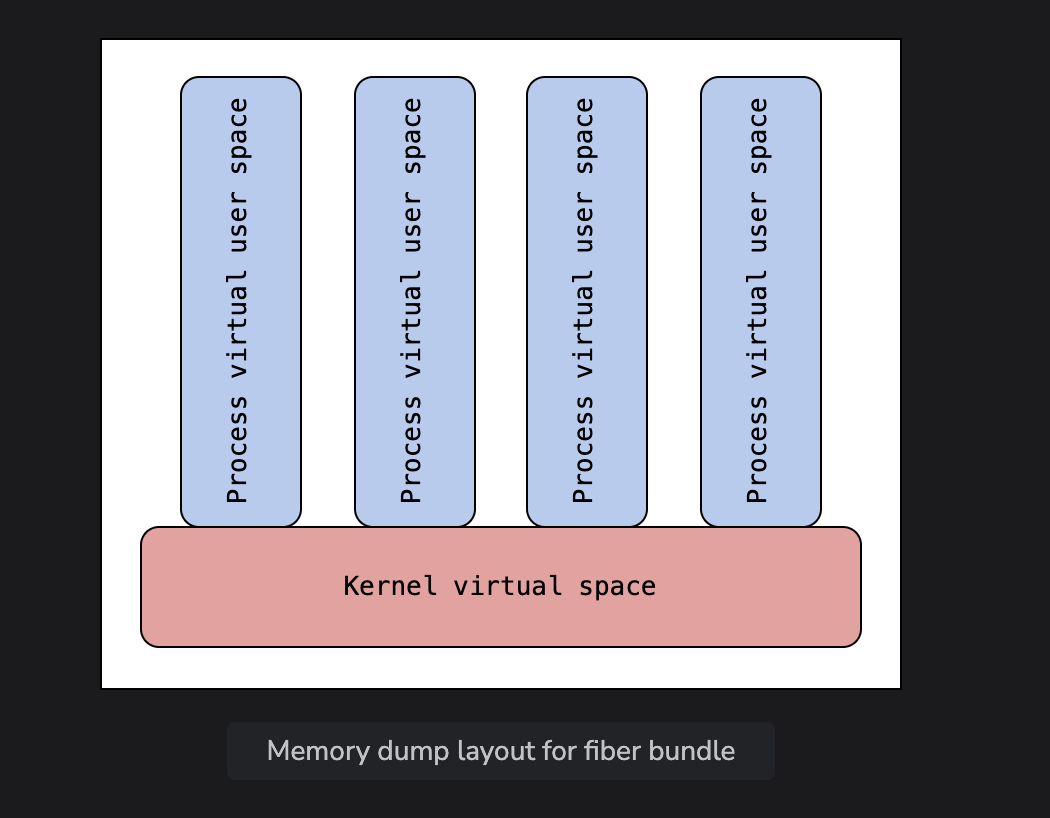
Fiber bundle -> dumping individual processes together with the kernel memory dump
Data Centers
HeMem Talk Feb 27th 2024
Monitors memory access async - PEBS - processor event based sampling - supported in modern Intel
HeMem policy moves hot pages from slow memory to fast memory, and cold pages down from hot memory to cold memory
NVM specific becuase its using NVM counters, can be used with CXL by using the CXL specific counters
Maybe allow the application to specify where in memory it can be
Currently tools to monitor bandwidth are not super great
Linux nimble tiered memory
Memory Overlays
Old systems used to shift stuff in and out of memory as needed,
Prefetching
Memory Access Patterns/Prefetching Series By Grant Ayers
Hashemi, Milad, Kevin Swersky, Jamie Smith, et al. “Learning Memory Access Patterns.” Proceedings of the 35th International Conference on Machine Learning, July 3, 2018, 1919–28. https://proceedings.mlr.press/v80/hashemi18a.html.
Ayers, Grant, Heiner Litz, Christos Kozyrakis, and Parthasarathy Ranganathan. “Classifying Memory Access Patterns for Prefetching.” Proceedings of the Twenty-Fifth International Conference on Architectural Support for Programming Languages and Operating Systems (New York, NY, USA), ASPLOS ’20, March 13, 2020, 513–26. https://doi.org/10.1145/3373376.3378498.
Litz, Heiner, Grant Ayers, and Parthasarathy Ranganathan. “CRISP: Critical Slice Prefetching.” Proceedings of the 27th ACM International Conference on Architectural Support for Programming Languages and Operating Systems (New York, NY, USA), ASPLOS ’22, February 22, 2022, 300–313. https://doi.org/10.1145/3503222.3507745.
Ayers, Grant, Jung Ho Ahn, Christos Kozyrakis, and Parthasarathy Ranganathan. “Memory Hierarchy for Web Search.” 2018 IEEE International Symposium on High Performance Computer Architecture (HPCA), February 2018, 643–56. https://doi.org/10.1109/HPCA.2018.00061.
Jamilan, Saba, Tanvir Ahmed Khan, Grant Ayers, Baris Kasikci, and Heiner Litz. “APT-GET: Profile-Guided Timely Software Prefetching.” Proceedings of the Seventeenth European Conference on Computer Systems, March 28, 2022, 747–64. https://doi.org/10.1145/3492321.3519583.
Ayers, Grant, Nayana Prasad Nagendra, David I. August, et al. “AsmDB: Understanding and Mitigating Front-End Stalls in Warehouse-Scale Computers.” Proceedings of the 46th International Symposium on Computer Architecture, June 22, 2019, 462–73. https://doi.org/10.1145/3307650.3322234.